01
Overview
A volunteer project for SDOT
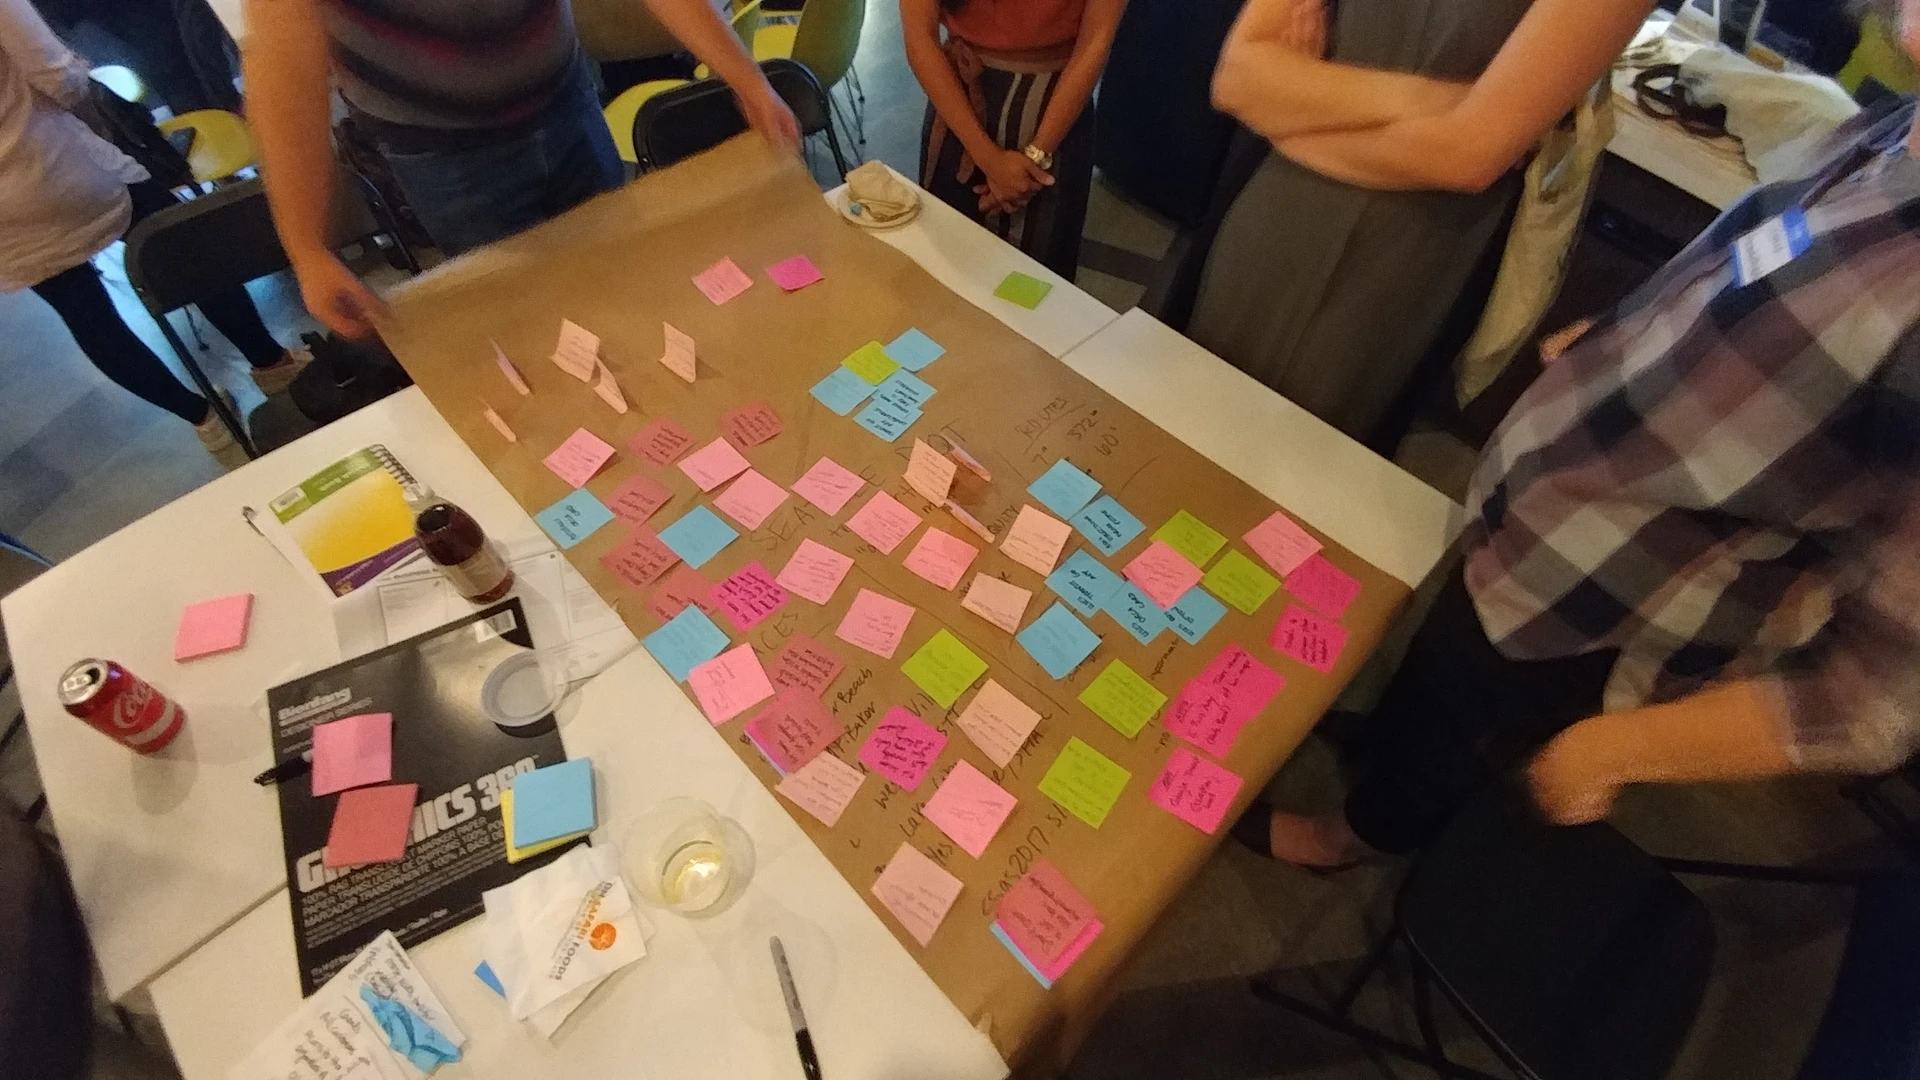
This volunteer project was part of the Seattle Social Good Series, presented by IxDA Seattle and Open Seattle, which paired volunteer designers and technologists with local organizations, mostly nonprofits and small companies. It opened with a mixer where each organization had a table and volunteers walked around offering UX and product advice.
At the hackathon that followed, volunteers signed up for a project and ran design thinking exercises on its problem statement. I joined SDOT's team along with a few others from the UX field. We kept working for about a month after that, running guerrilla research and team meetings, then presented our findings to an audience at the series' final presentation and shared them with SDOT by email.
02
Challenge
Reaching the riders tech leaves behind
Our team was tasked with looking into possible solutions for an SDOT initiative aimed at the roughly 35% of Seattle residents who don't or can't use technology, such as cell phones or computers, to get the most out of public transit.
03
Process
Finding a solution that doesn't need a phone
The brief ruled out the obvious answer. Whatever we proposed had to work for someone with no smartphone, so the research had to start with the people themselves rather than with a screen.
Research
Research for this project included brainstorming sessions between group members. We researched all the various types of individuals that could benefit from possible onsite tech solutions. We also looked into similar solutions that other cities had invested in.
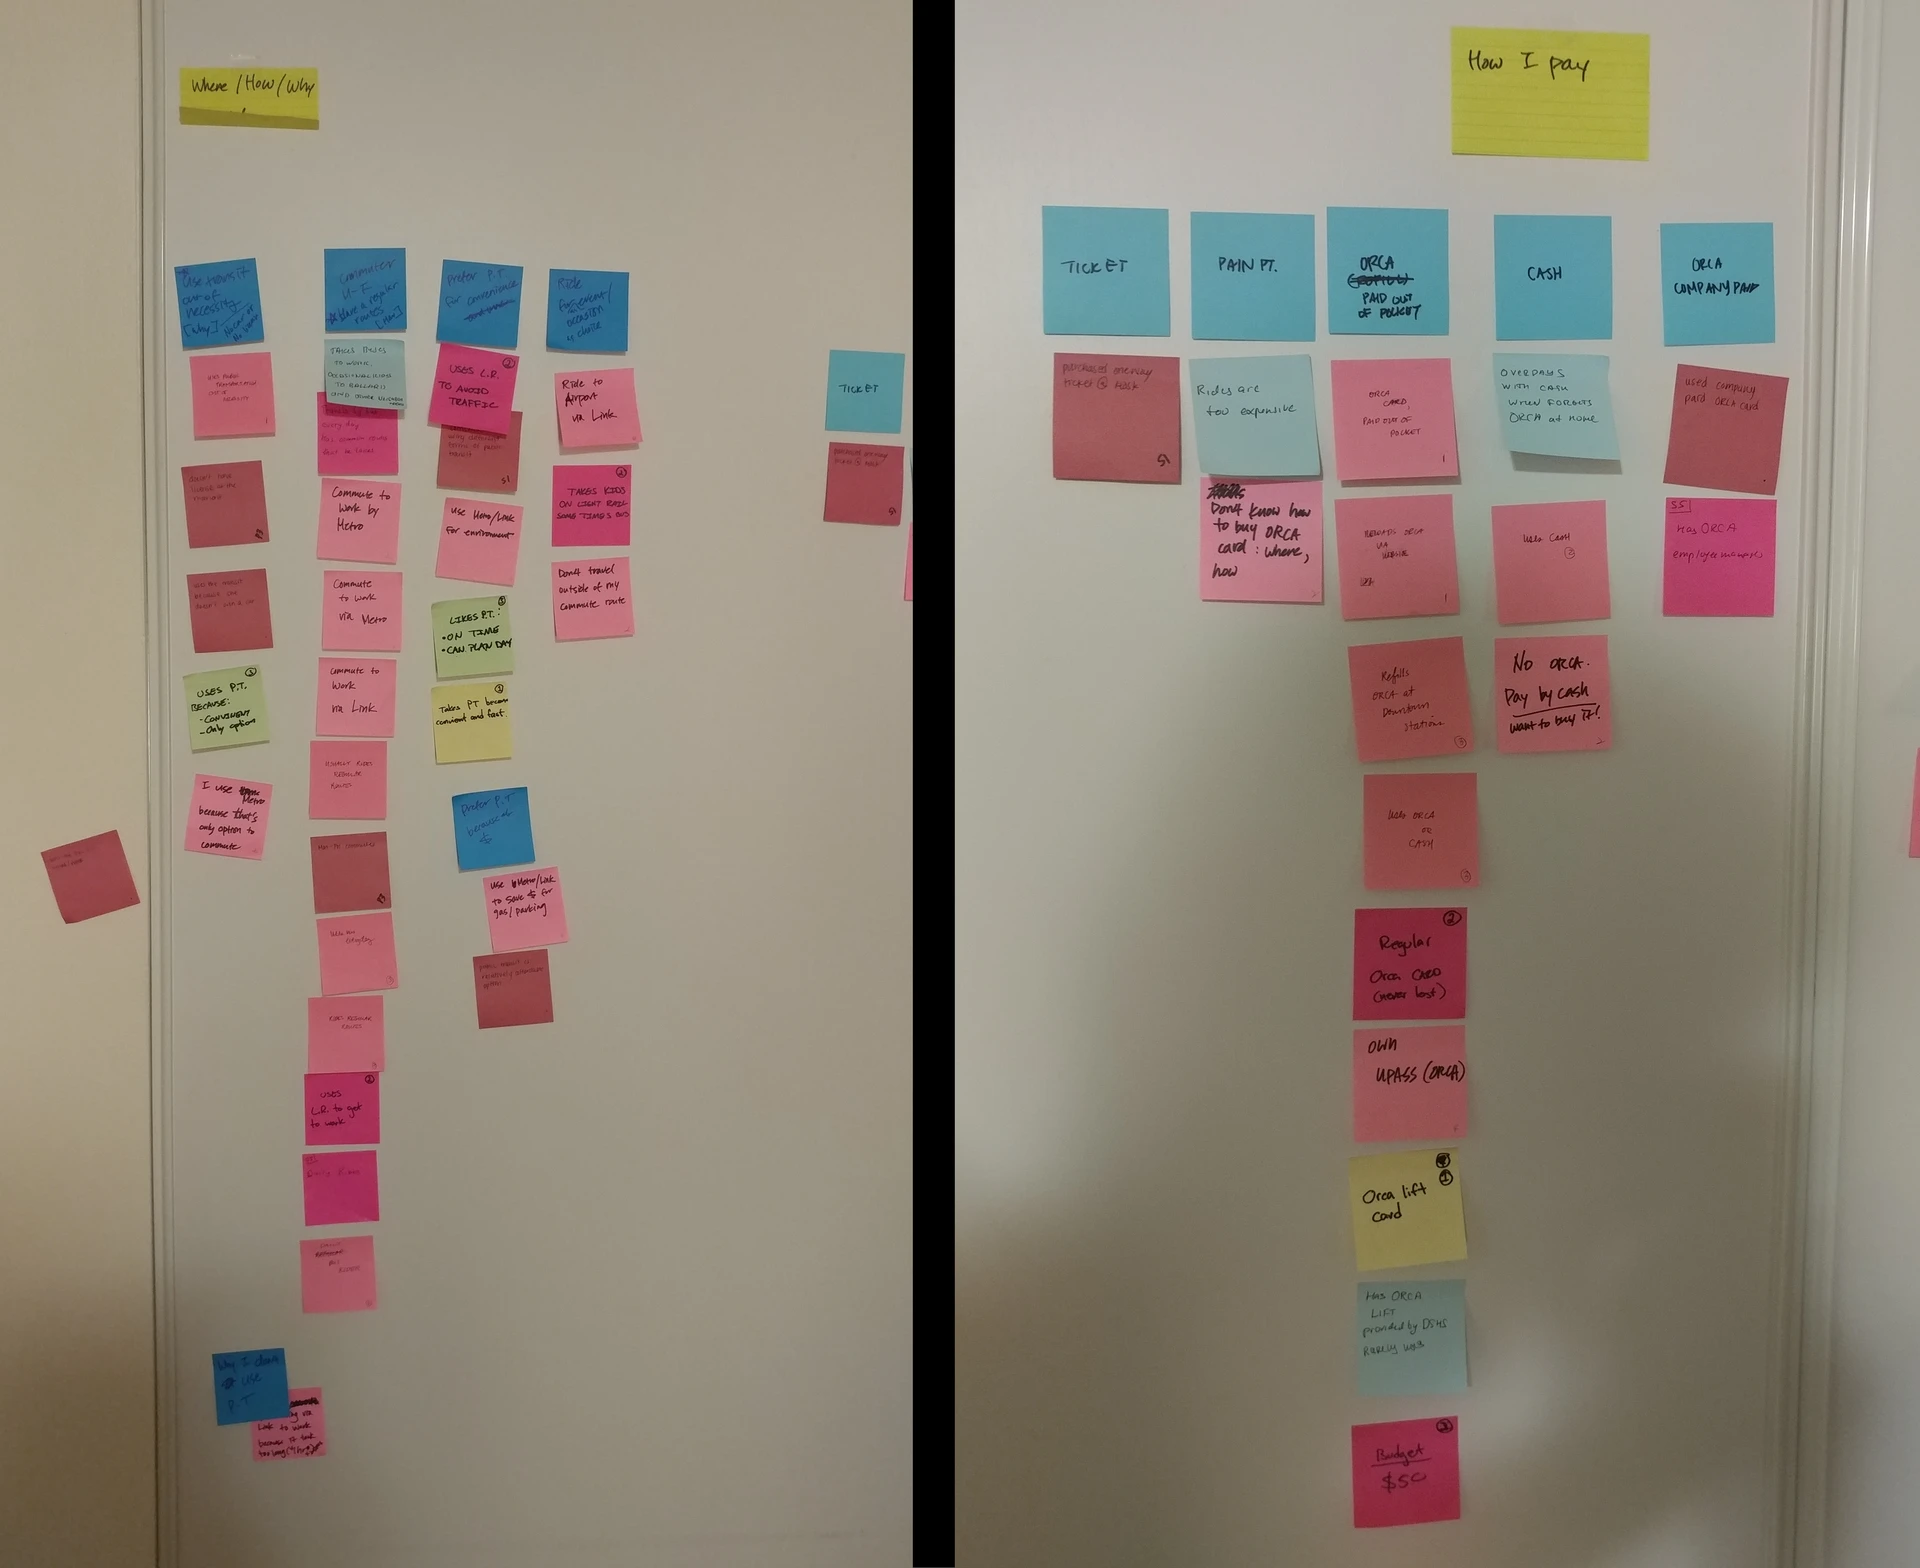
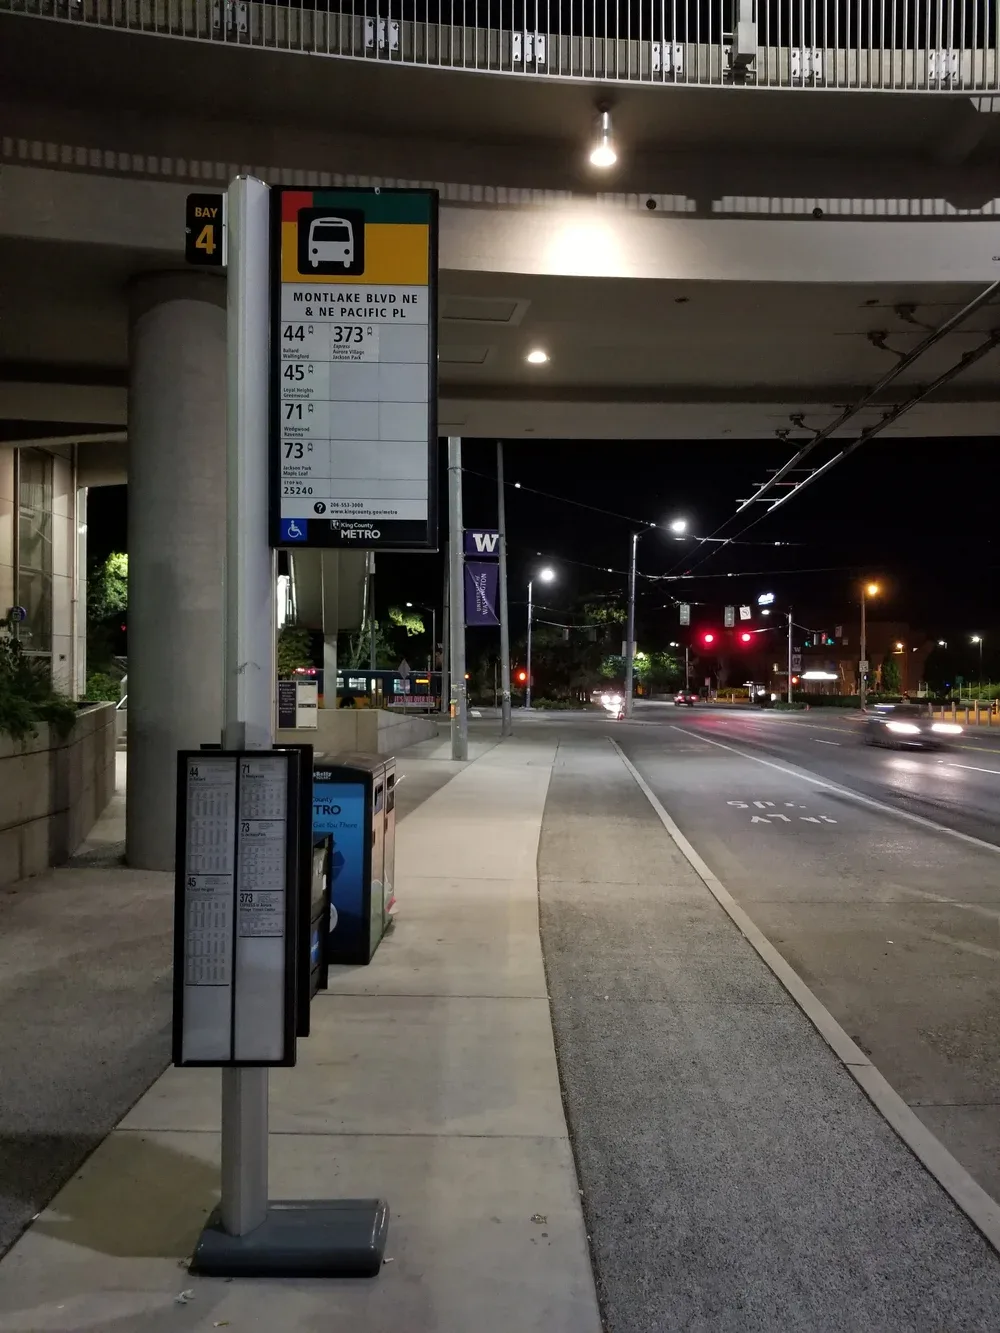
We also ran guerrilla research, using a series of questions based on our brainstorm sessions. We then traveled out to several bus and tram stops that SDOT had told us they had interest in for this study. At each location we spent time talking to as many users as would talk to us. We gathered their answers, organized them into buckets and pulled as many insights as we could from them.
Ideate
We ran through many possible solutions and narrowed it down to what we felt were three strong solutions of varying degrees of complexity using the concept of Walk, Run, and Jump.
In-person outreach (Walk). A low-cost solution: educating and informing people through various forms of local outreach, such as setting up official SDOT tables at farmers markets or other locations of interest outside of Seattle to reach patrons who might not have access to technology but would gather for other reasons.
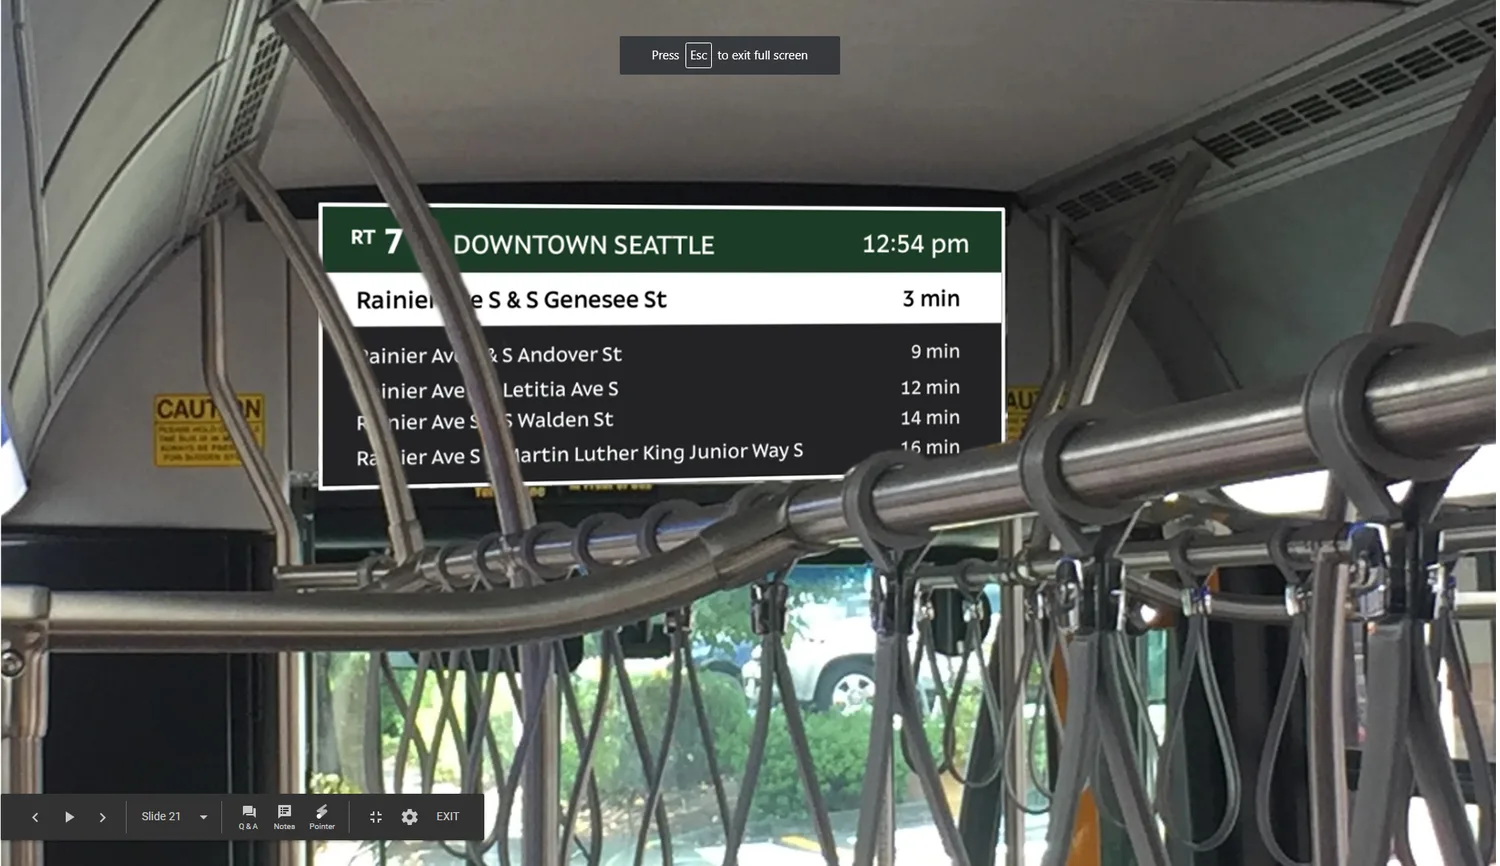
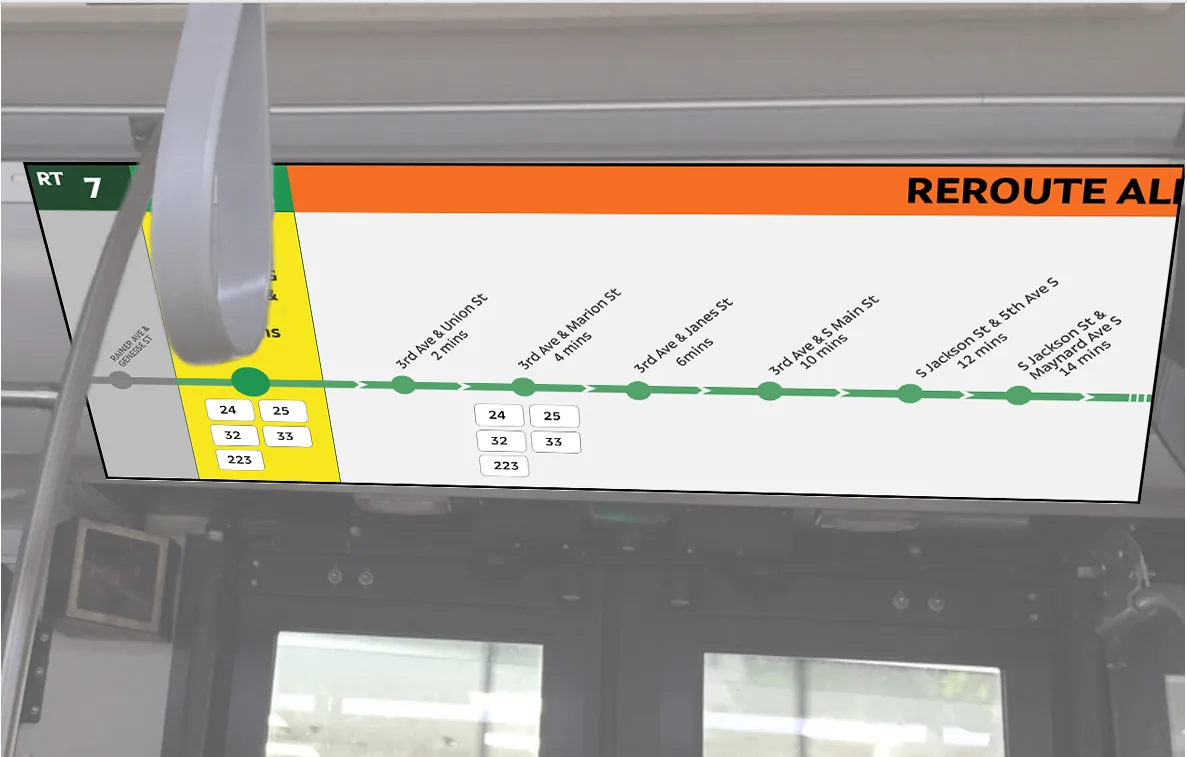
Informative signage on buses (Run). This solution would provide informational services to riders who were already on a bus but did not have technology to help navigate to their destination. This solution would see installation of video screens and/or informative static posters into the unused overhead spaces on buses that would clearly communicate the stops the bus will make, the stops before and after the current one, and the time between each stop. To increase accessibility with non-English-speaking riders the signs would attempt a combination of universal iconography and words.
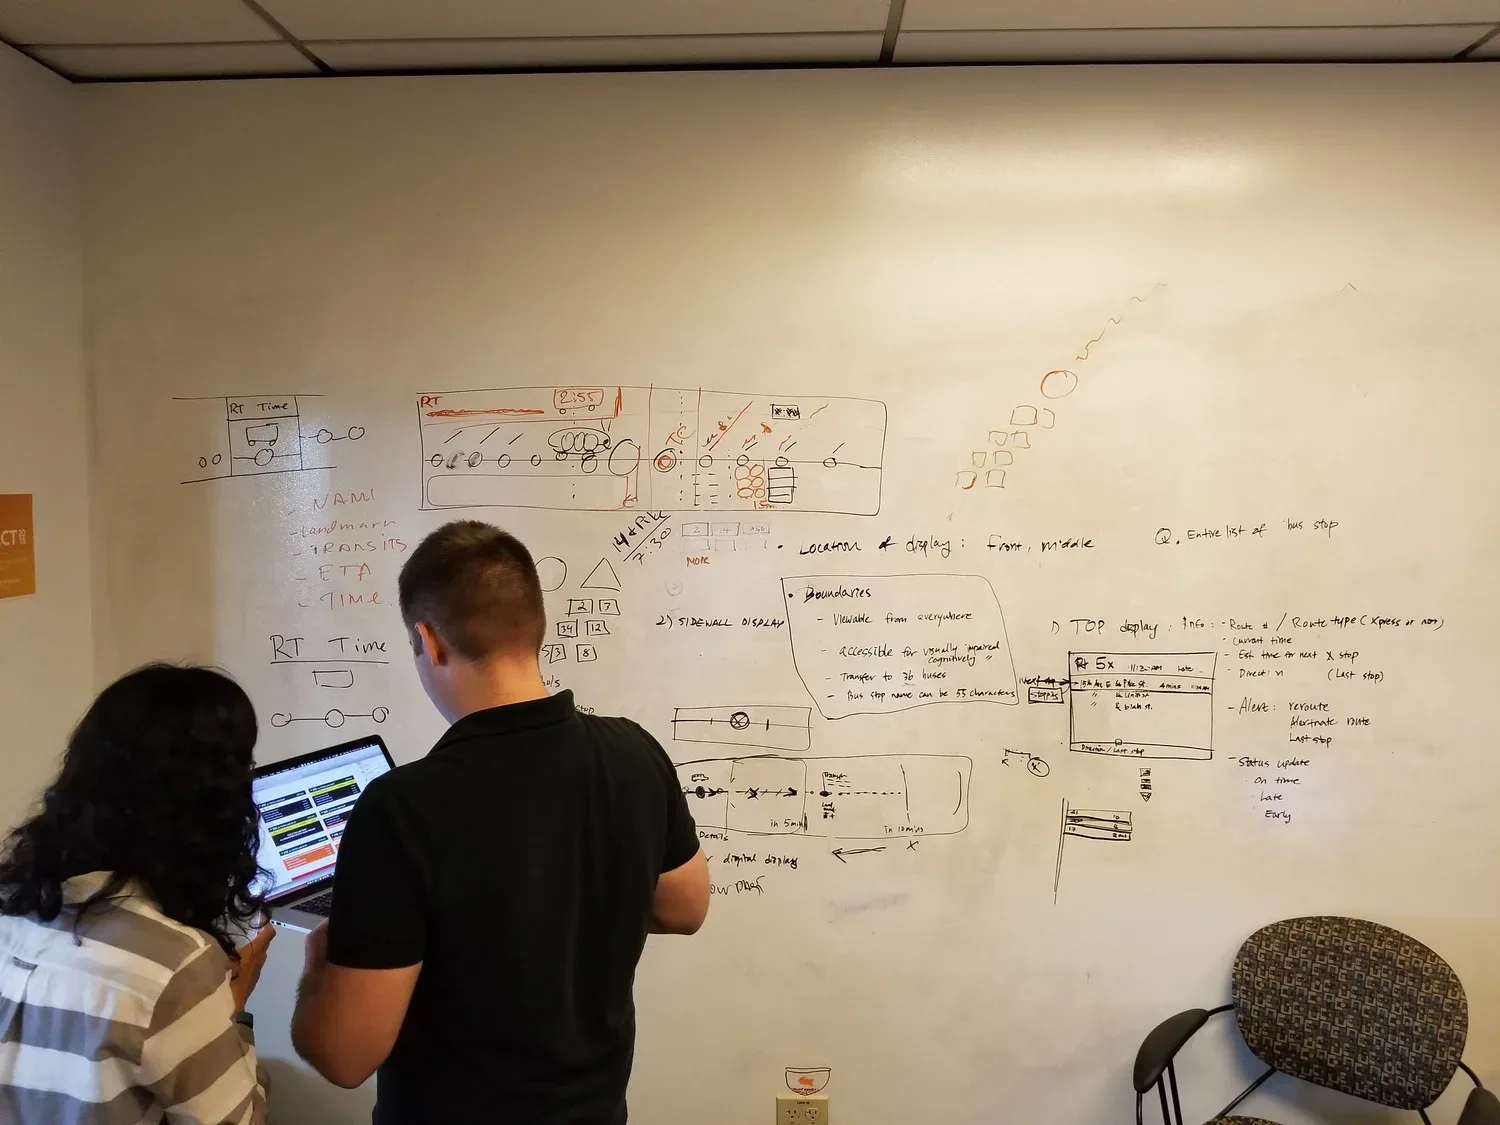
SDOT kiosks (Jump). Our two SDOT representatives discussed this as a possible idea during our first meetup. Our group then took the idea and iterated on it further until we had a fairly actionable solution. Initial SDOT information kiosks would be set up at bus stops and train stations in the locations that SDOT had flagged as areas of interest. The kiosk would provide anyone with the same navigational and informative services that many access on their smartphones.
Someone would walk up to one of these friendly and inviting kiosks, interact with it in the language they are most comfortable using, enter a desired destination and the kiosk would print out a small, easy-to-understand sheet or card with directions that the user could take with them. Alternatively, the user could have the directions sent to their mobile phone as a text message.
Prototype
I prototyped the information screens that would be installed on the buses, and what they'd show riders.
04
Outcome
What we delivered
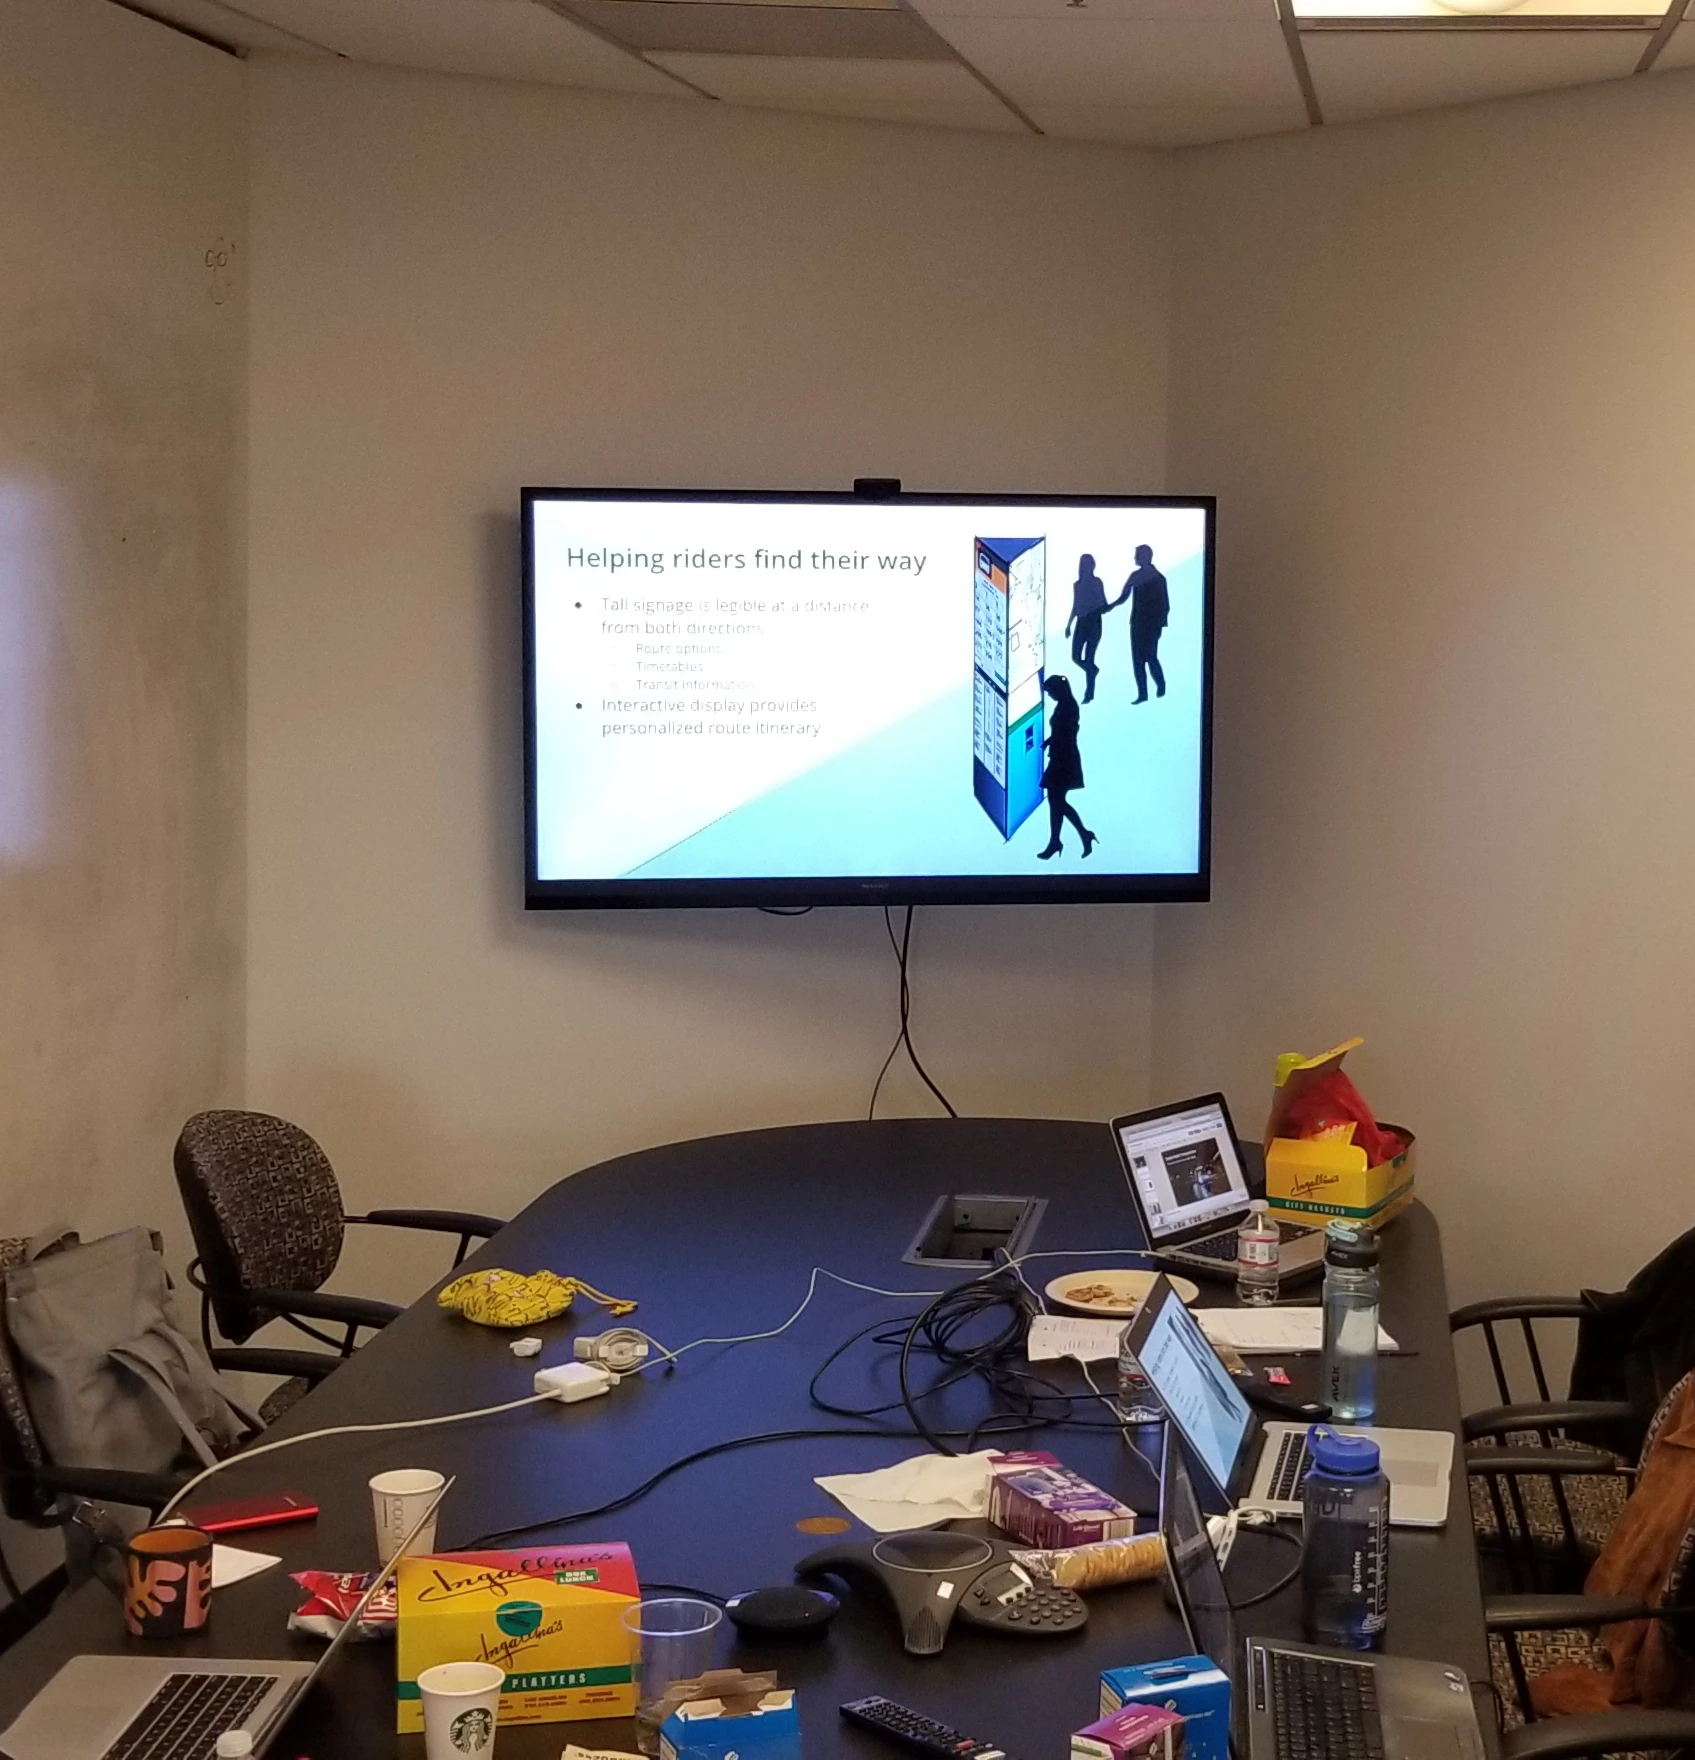
The work produced three solution directions of increasing ambition (in-person outreach, on-bus signage, and multilingual SDOT kiosks), along with prototypes for the on-bus information displays.
05
Revisited
An exercise: the research as a service blueprint
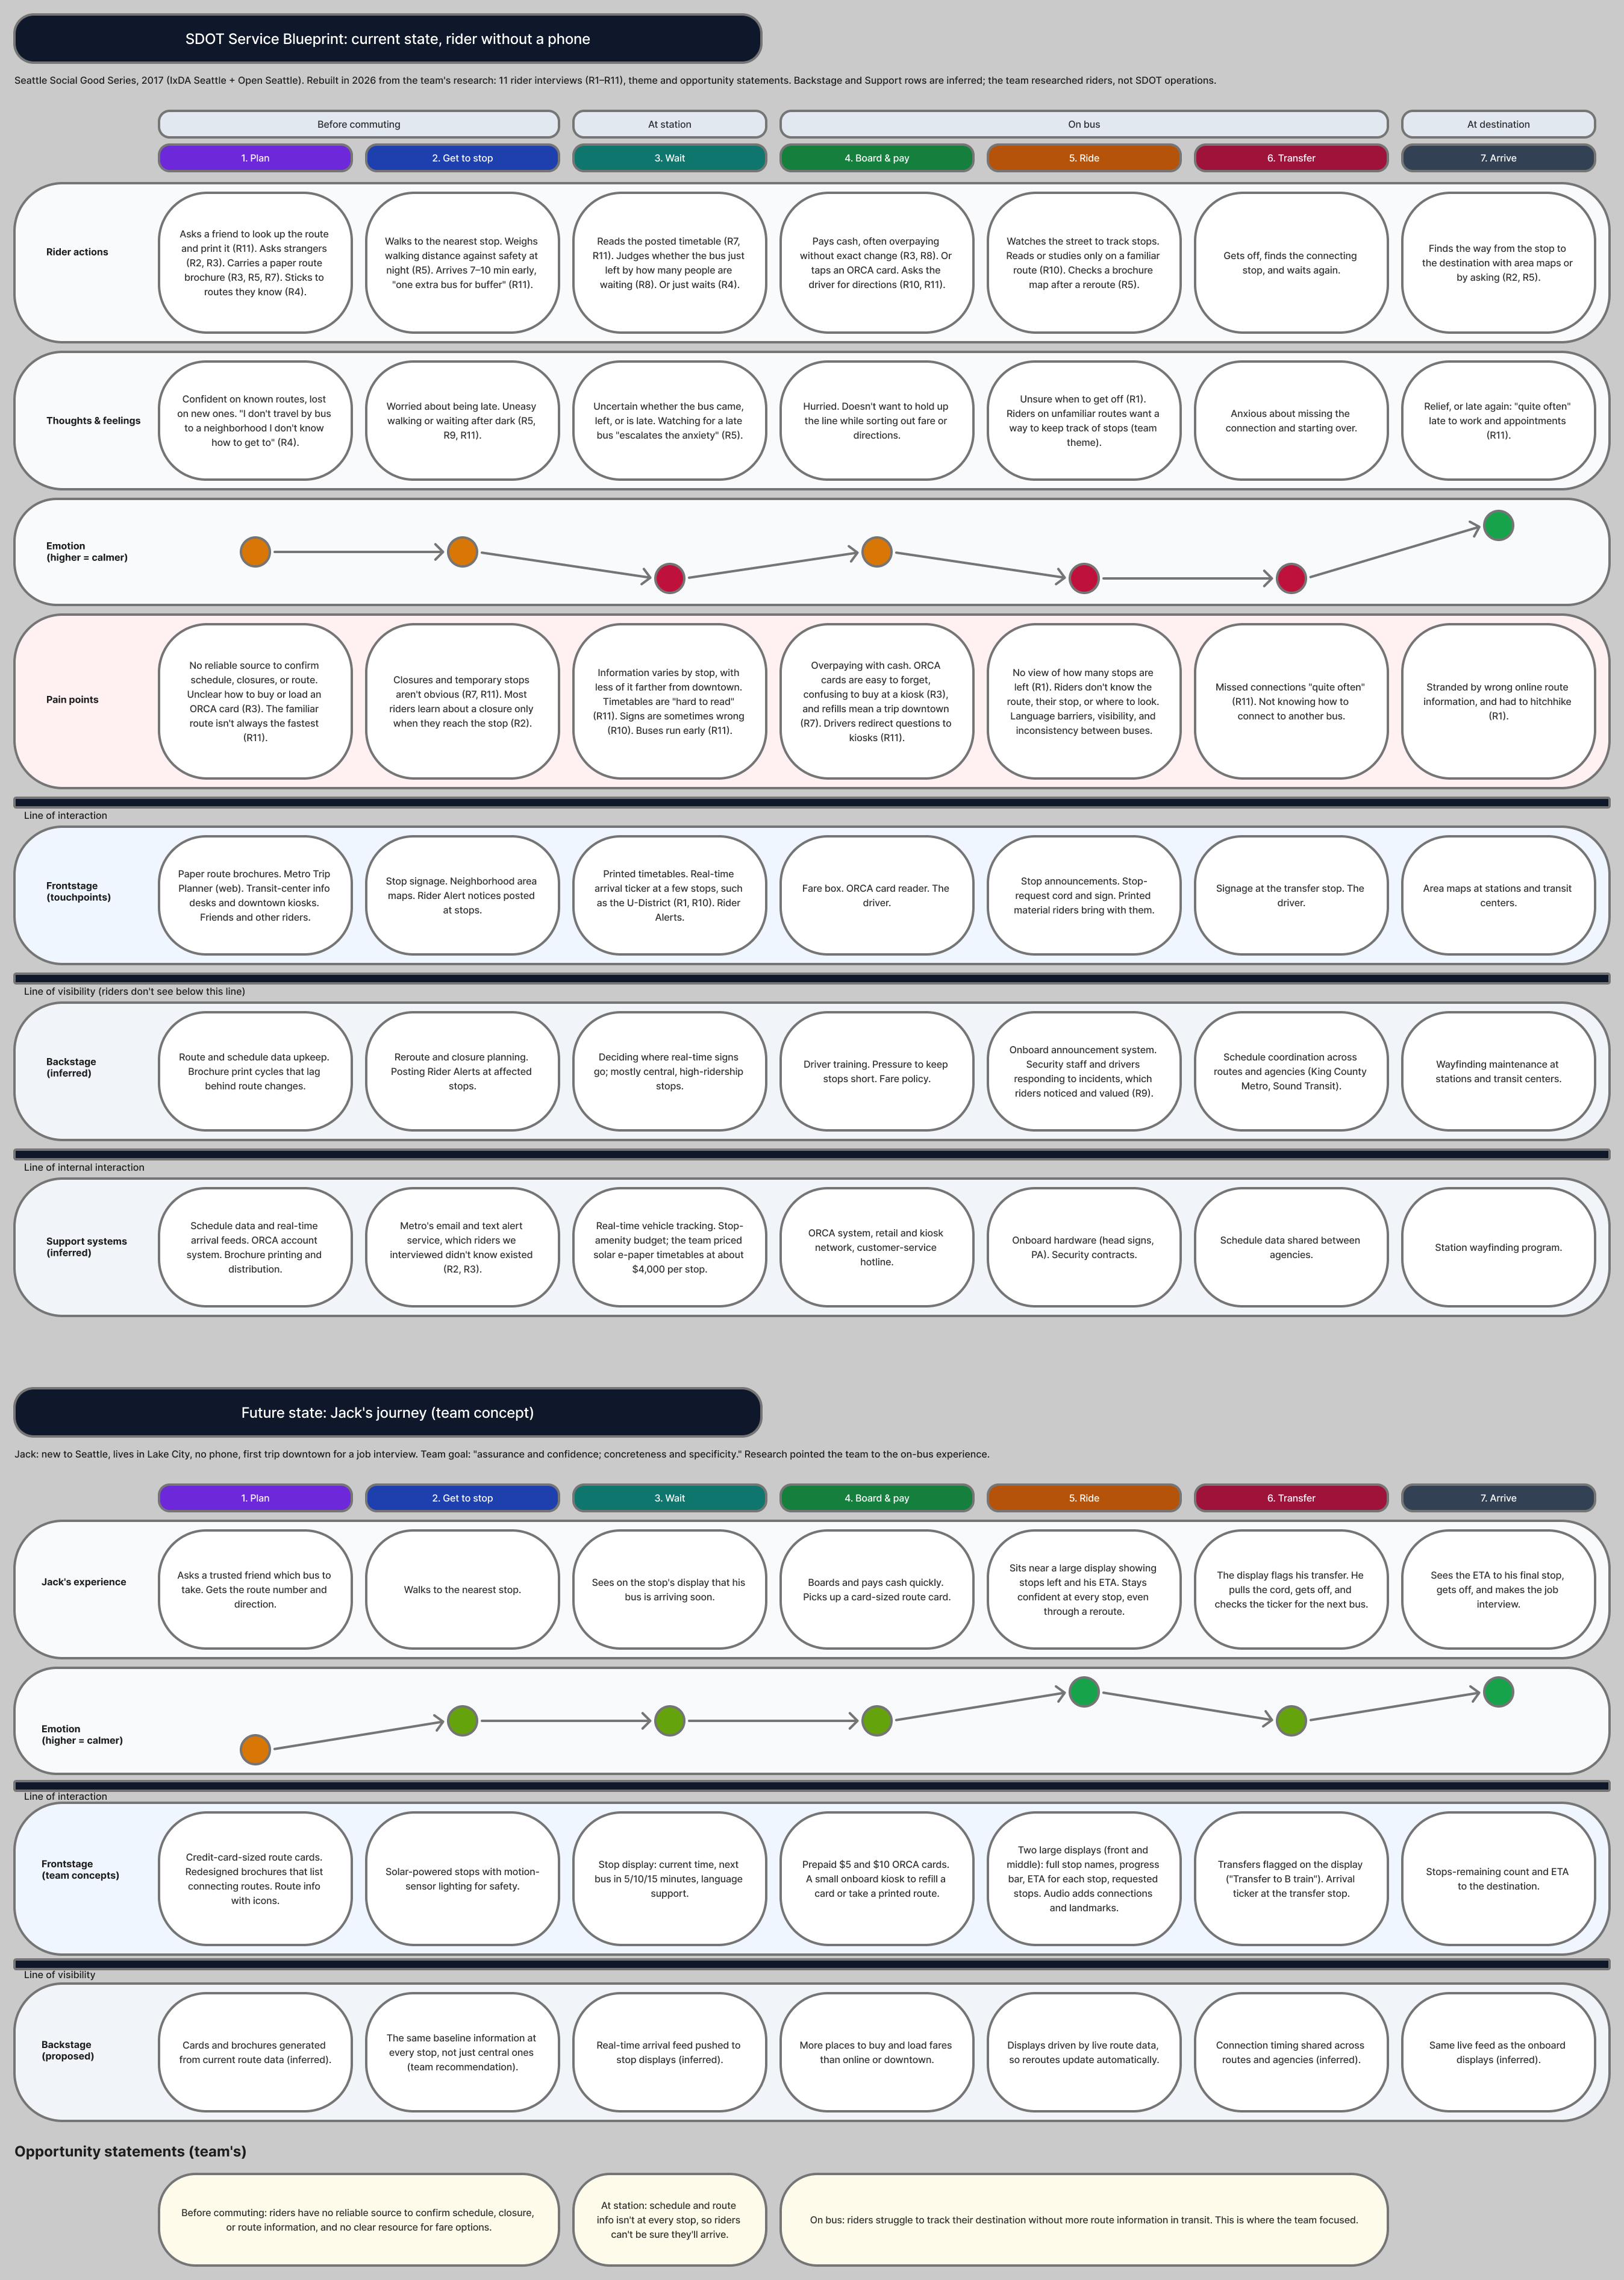
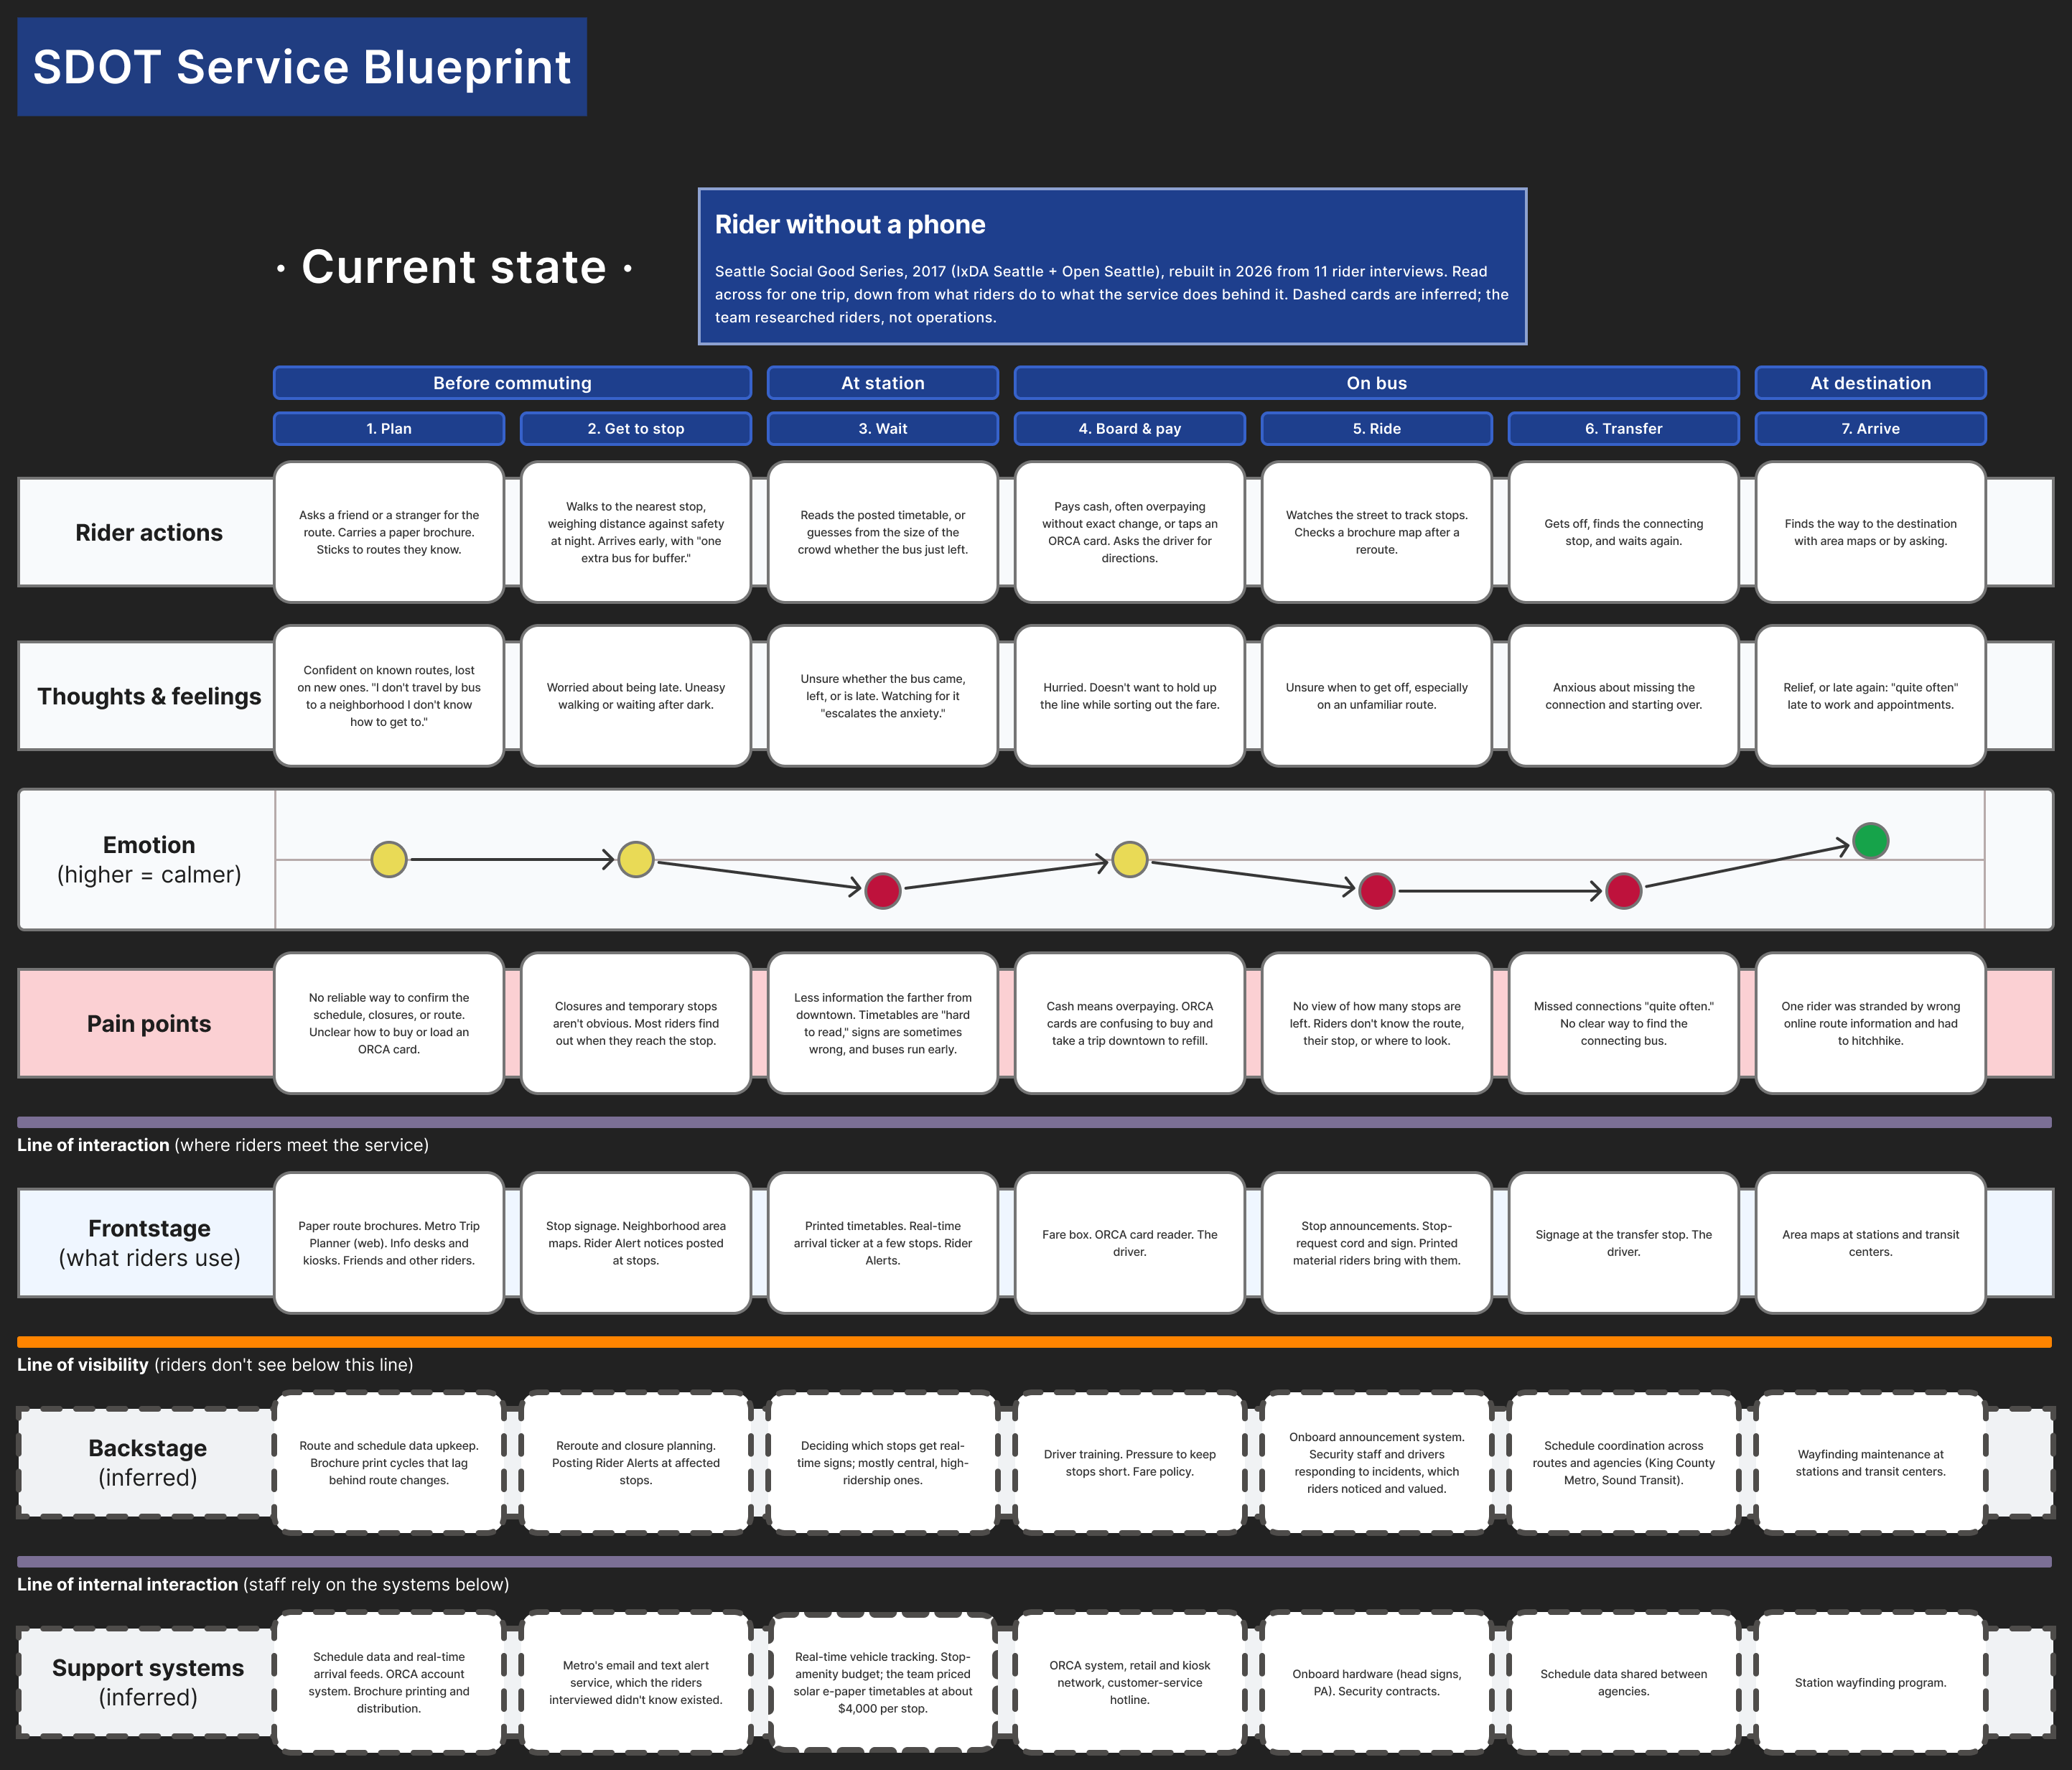
In 2026 I went back to our team's research folder for an exercise: have Claude read through the documents (notes from 11 rider interviews, our themes, and our opportunity statements) and create a first-pass service blueprint that I could then edit. A service blueprint is a diagram that lines up what a customer does with what the service does to support each step. We didn't make one in 2017.
Claude built the first pass in FigJam through ClaudeJam, and I restyled and edited it in Figma. End to end, it worked. It was also good practice for me: I hadn't needed to make a service design artifact in quite some time.
Current state
The top rows come straight from the interviews: what riders without a phone do, think, and struggle with at each step of a trip. The rows below the line of visibility are my inference about SDOT's and Metro's side, since we talked to riders and not to staff. Those cards are dashed so the difference is visible.
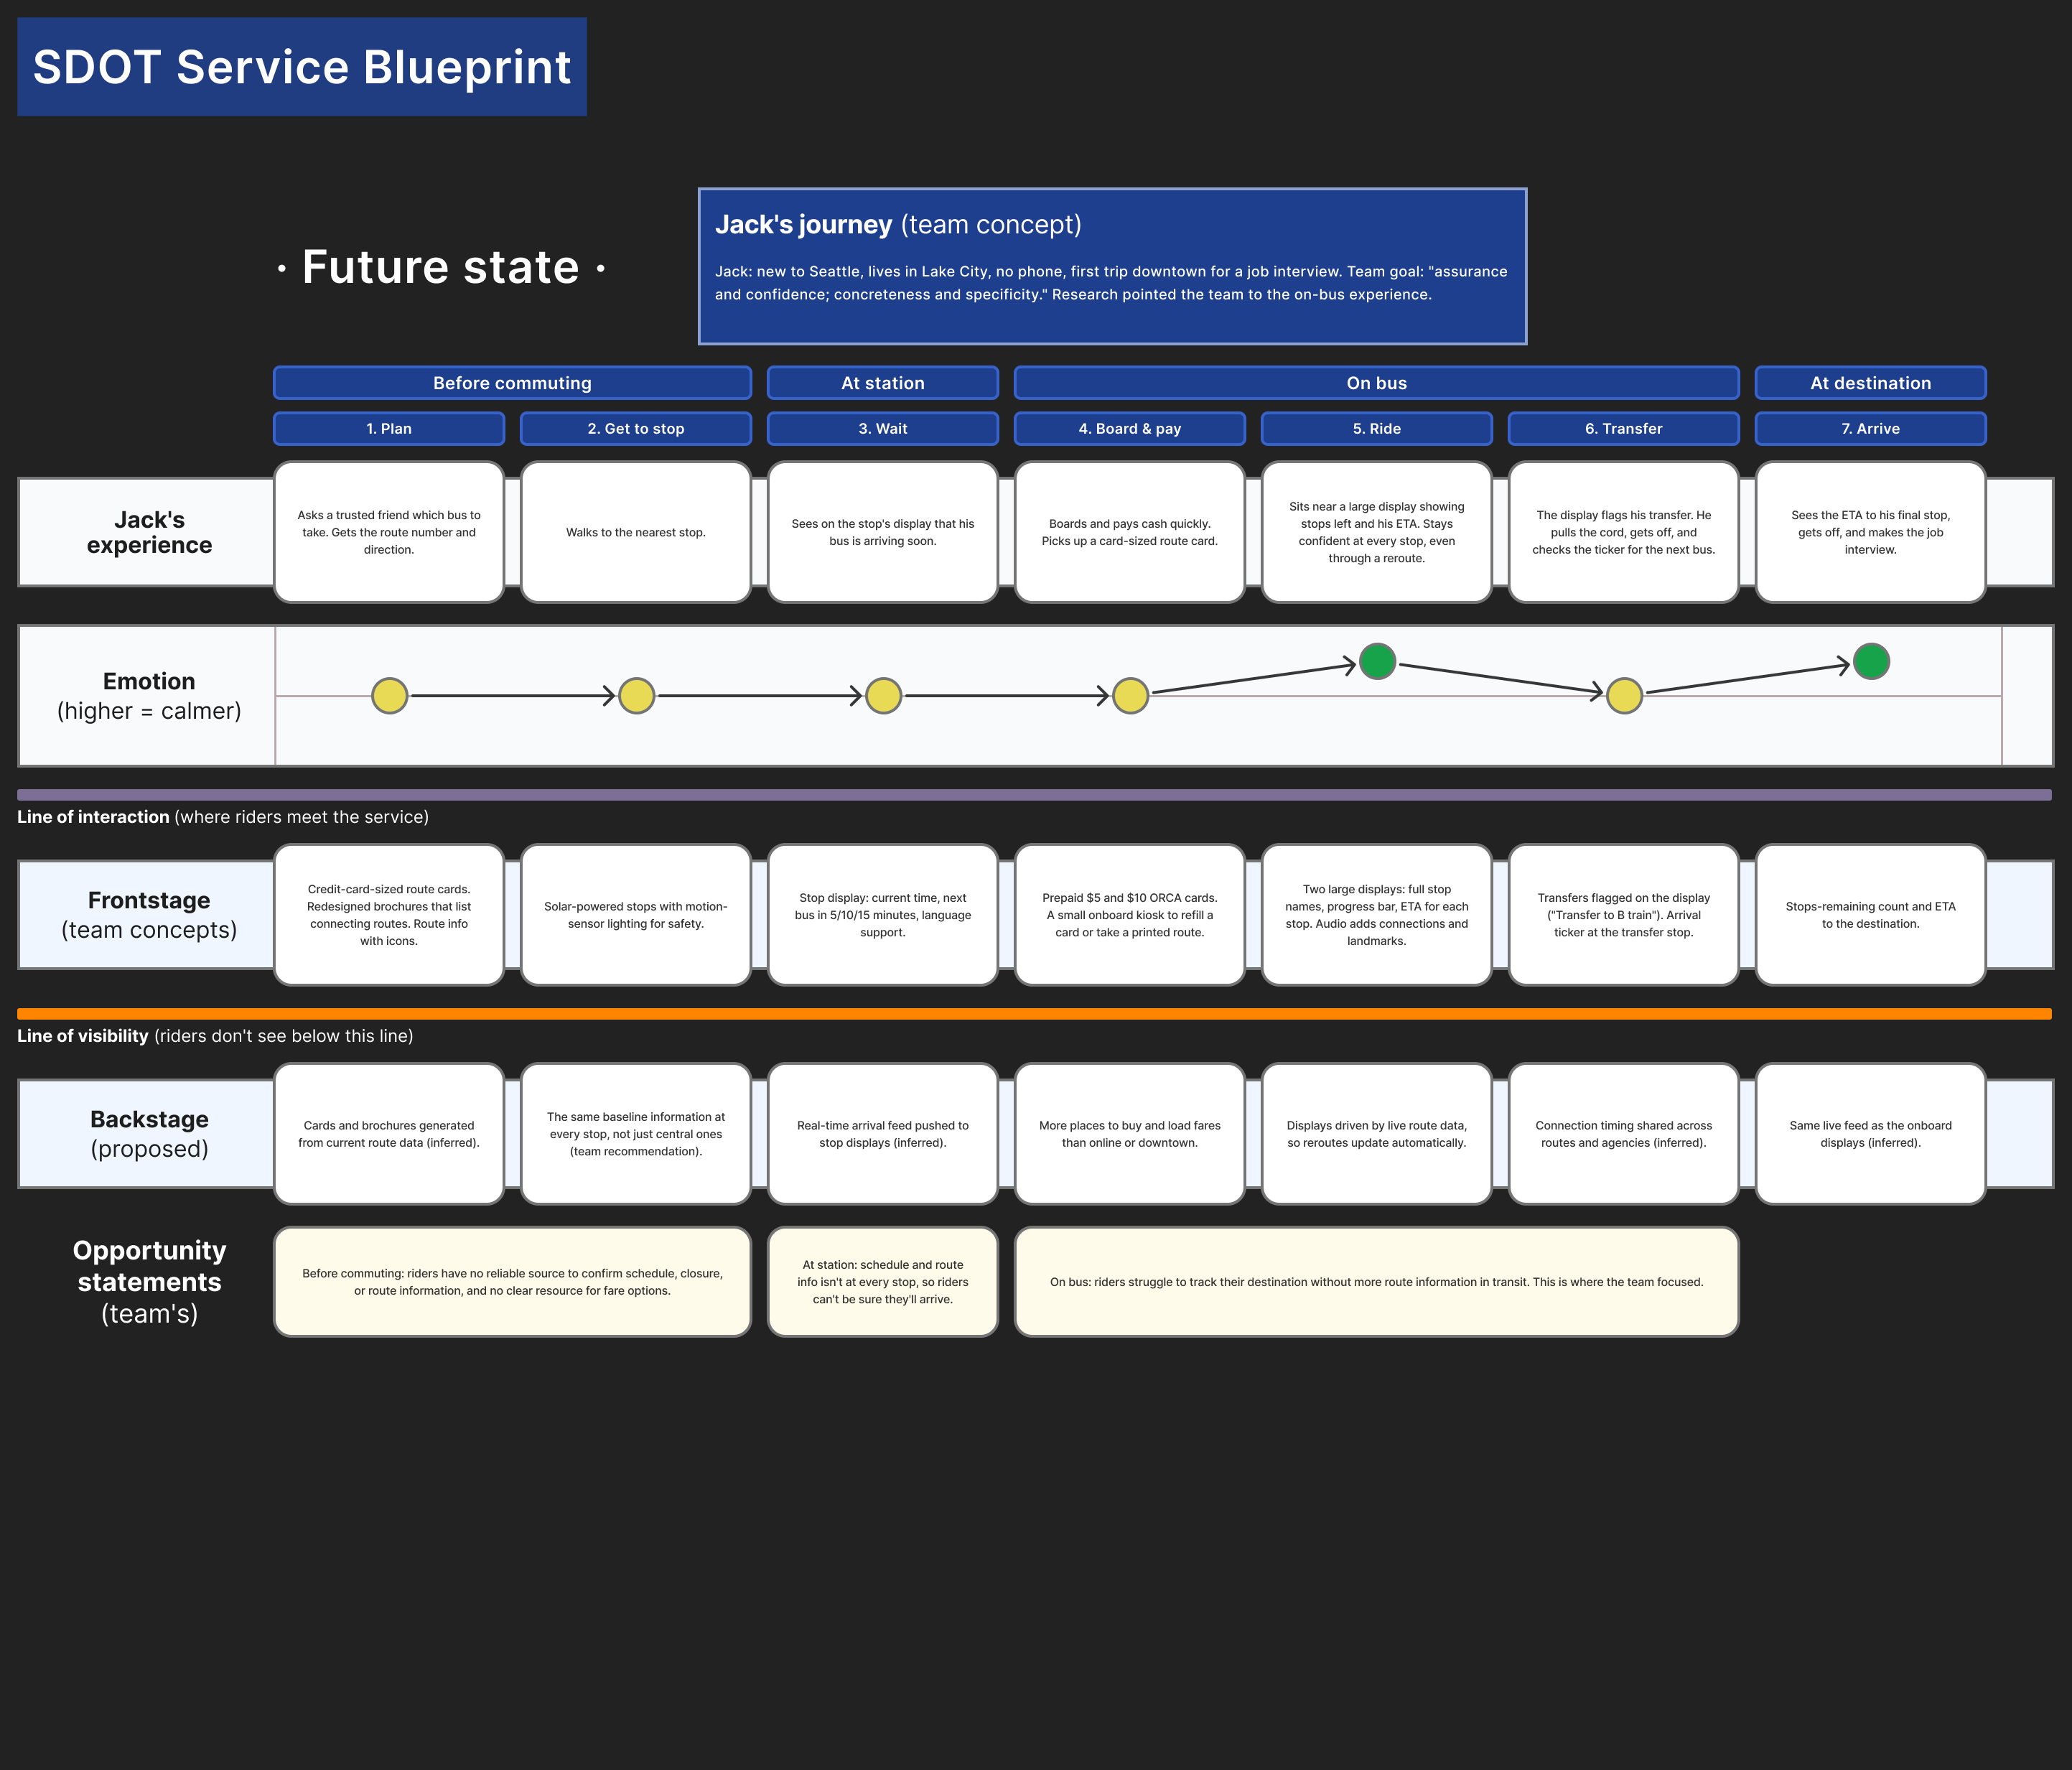
Future state
The research kept pointing at the ride itself: riders didn't know how many stops were left or when to get off. The second blueprint walks Jack, the persona our team wrote, through the same trip with the team's concepts in place, including the on-bus displays I prototyped.